PREDICTION RECORD · PUBLISHED 2026-09-12 18:15 UTC
XOM
Exxon Mobil
EXCESS -6.3 PTS
SECTION 01 — THE LIFECYCLE
EVERY MOVE. TIMESTAMPED.
SECTION 02 — THE RECORD SO FAR
PRICE, WITH CONTEXT.
$165.99TARGET
$185.91INVALIDATION
$154.37LAST
$158.71PUBLICATION
2026-09-12UPDATES
1
INTERACTIVE PRICE — TRADINGVIEW
THE MARKET RECORD.
SECTION 03 — WHY FINNENCE BELIEVED IT
THE CASE, ON RECORD.
Original thesis (immutable)
XOM shows strong, persistent multi-timeframe momentum (ret_60d +17.8%, ret_20d +5.3%, ret_5d +2.3%) with top-decile relative strength vs SPY across 5/20/60d horizons and a near-max momentum score (1.0) in the attractiveness framework. Fundamentals are supportive: forward PE 15.4 vs trailing 21.4, revenue growth +44%, earnings growth +113%, low debt/equity (15.9), and robust FCF (~$20.7B). News flow is net bullish (oil price strength, Venezuela/Iran catalysts, repeated positive price-move events). Key caveats: the stock is only ~1.9% below its 52-week high (pos_52w 0.948), vol is elevated (~23-24% annualized), and the 20d return z-score is modest (0.24), suggesting the move is not statistically exceptional and near-term asymmetry is limited. Key risk: momentum may be largely priced in near the top of its range, which caps confidence. Net: constructive BUY with disciplined risk controls rather than an aggressive chase.
No structured audit record for this thesis (issued before the v2 selector). SEE THE UPDATES BELOW →
- Momentum is dominant: 60d return +17.8%, 20d +5.3%, and 5d +2.3% with momentum score 1.0.
- Relative strength is strong: rs_spy_60d +15.6%, rs_spy_20d +7.1%, and 20d percentile rank 0.82.
- Positioned near highs: 52w position 0.95, only 1.9% below the 52-week high, with shallow drawdown.
- Fundamentals support upside: forward PE 15.4 vs trailing 21.4, revenue growth 44.1%, earnings growth 112.8%.
- Momentum is stretched: ret_60d +17.8%, pos_52w 0.95, only 1.9% below 52w high.
- Relative strength vs sector is negative: rs_sector_20d -1.35%, lagging energy peers.
- Valuation is rich: trailing PE 21.4, priceToBook 2.63, PEG 1.41.
- Correlation to SPY is negative (-0.42 60d), so broad-market support is absent.
- Close below the 20-day moving average on above-average volume
- Breakdown in WTI/Brent crude oil prices (e.g., WTI losing key support) undermining the energy-major earnings thesis
- Relative strength vs SPY (rs_spy_20d) turning negative for 5+ consecutive sessions
- Failure to hold the recent breakout level / a close back below the pre-breakout consolidation range
- Adverse geopolitical de-escalation that removes the oil supply-risk premium
- Deterioration in forward earnings estimates or a negative 8-K/guidance revision
No deterministic cause identified
▸ TRADE QUALITY BREAKDOWN · COMPONENTS ×14
TRADE QUALITY BREAKDOWN
SECTION 04 · MARKET REGIME AT PUBLICATION
THE WEATHER THEN.
METHODOLOGY · PAPER ONLY
← BACK TO THE LEDGER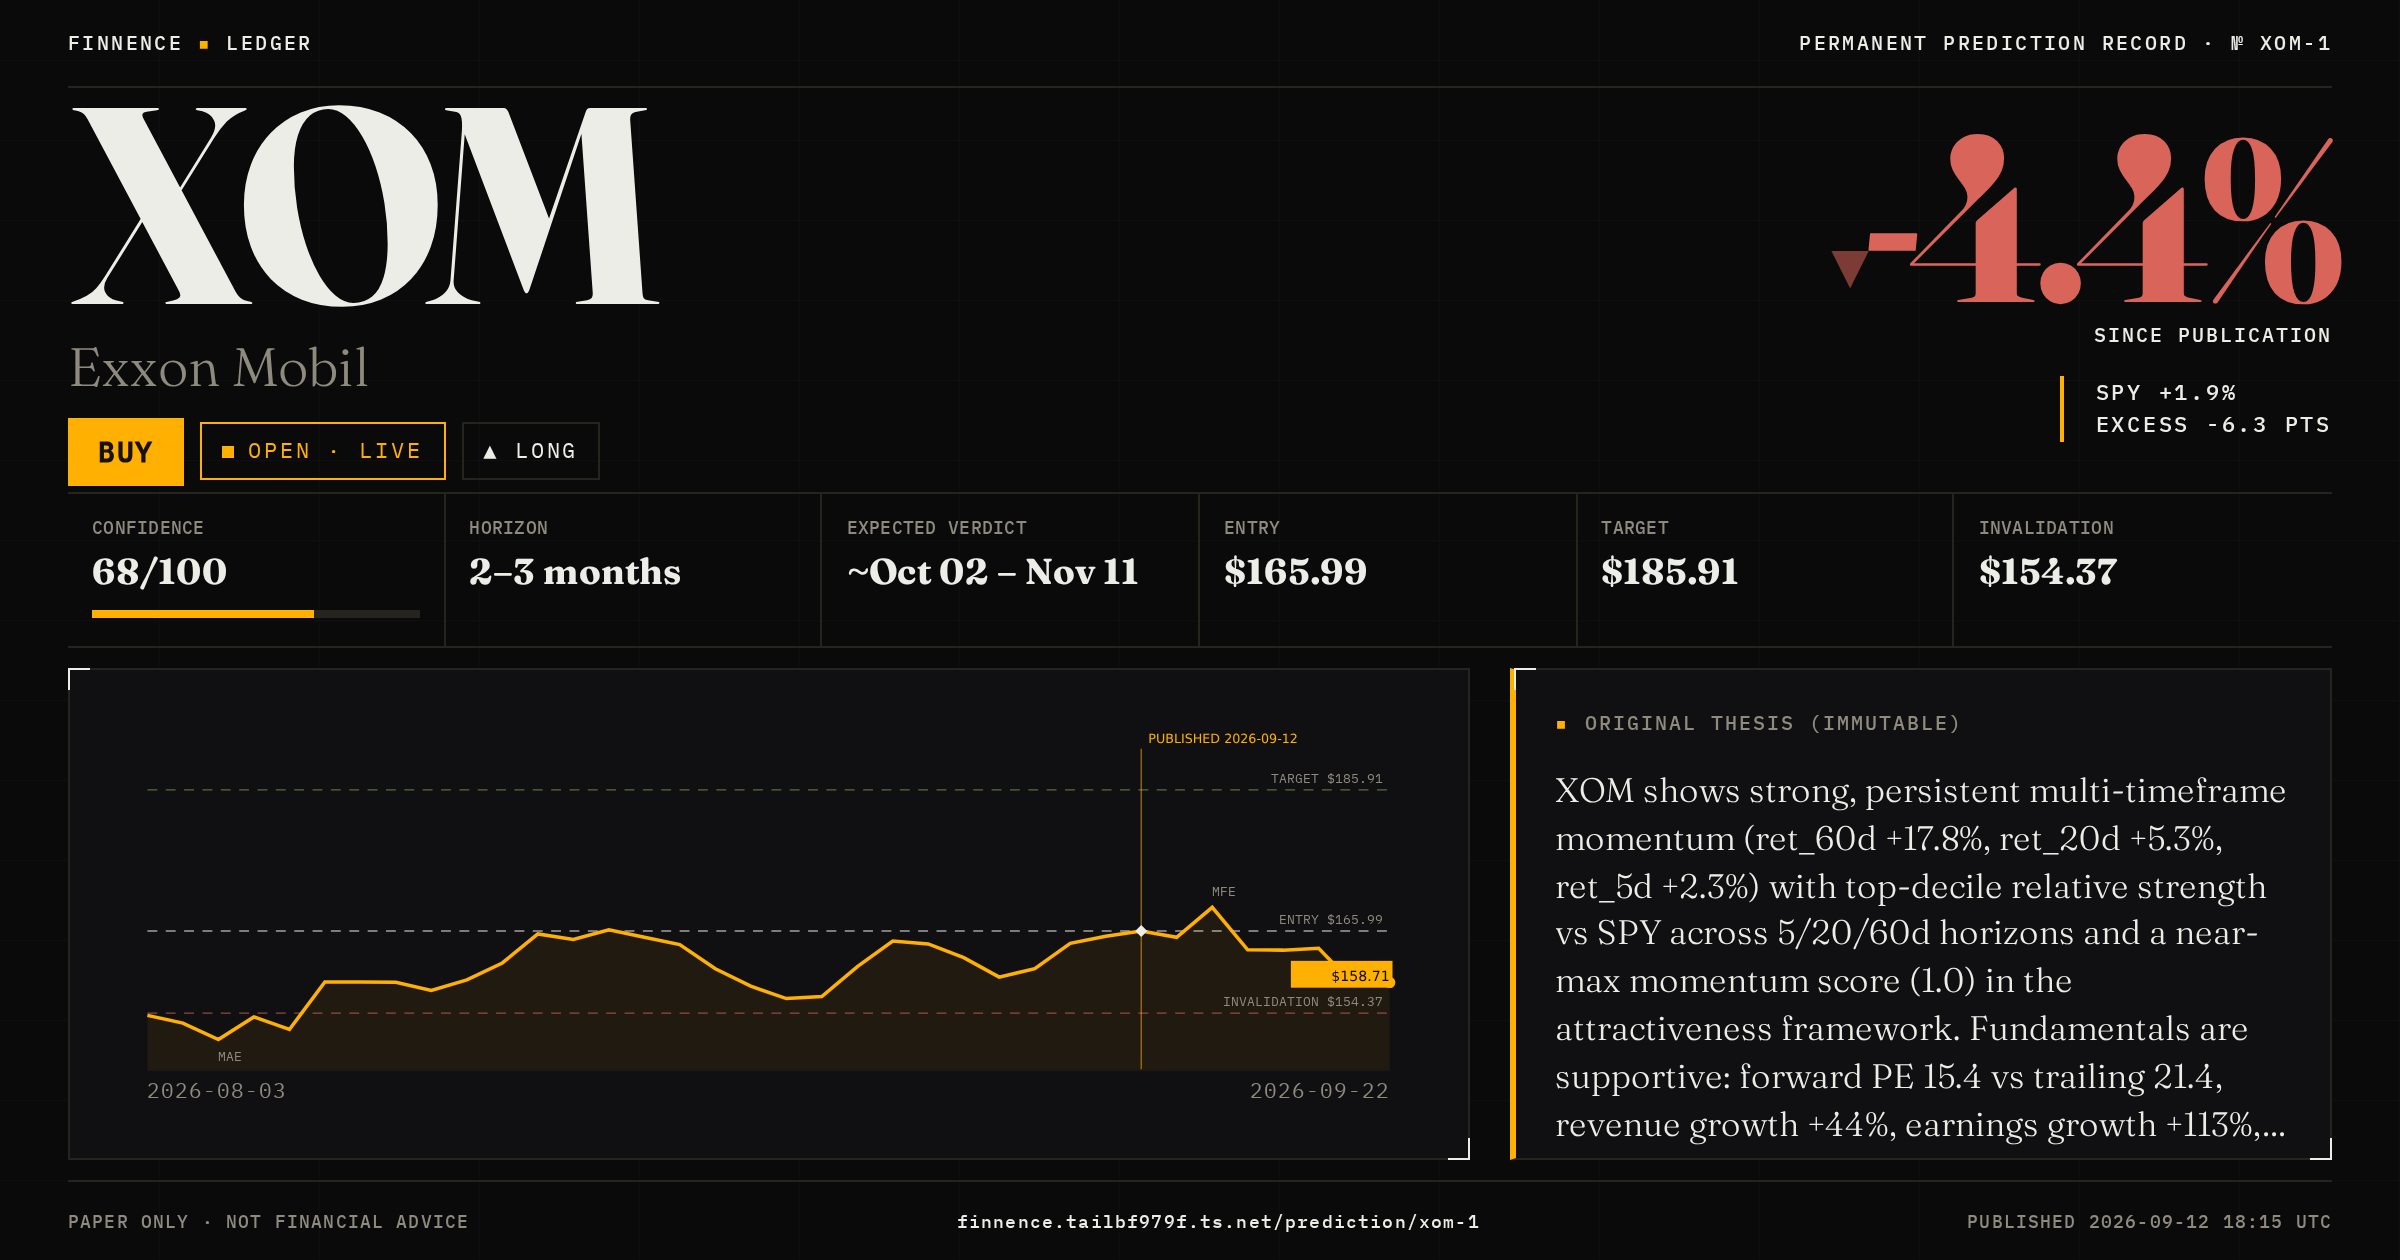
Original thesis (immutable). This permanent, timestamped record preserves the published call; later changes append and never overwrite it. PAPER ONLY · NOT FINANCIAL ADVICE.
OPEN THE MACHINE →